In 1996 I bought a new BMW 318ti. Since I had acquired the habit of recording my gas usage in detail when I owned my previous car, I kept doing it for this car. I've used that data to do a simple study of fuel economy as a function of driving habits.
First, here's a summary of the fuel usage over the life of the car...
The options on this car were the "active" package and an automatic transmission.
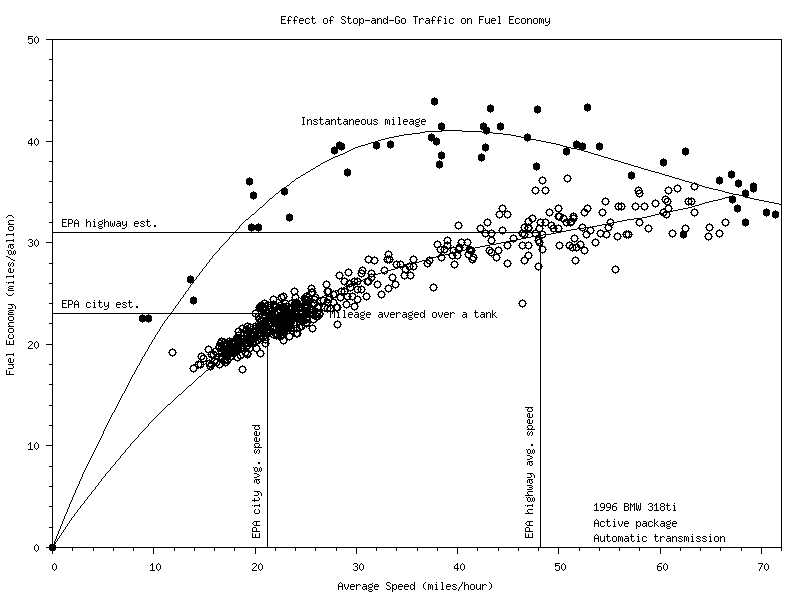
Of course, fuel economy is a strong function of how a car is driven. My average mileage was not very high because I did most of my driving in the city. To try and see exactly how the type of driving affected fuel economy, I always recorded data from the on-board computer that let me compare my fuel economy under different driving conditions. The results are seen in the next plot which shows fuel economy vs. speed.
The upper curve in the plot shows the relation between fuel economy and speed if the speed was held constant. The data was obtained by reaching a constant speed, resetting the average speed and MPG readings on the on-board computer, driving for a bit, then reading the values from the computer. The filled symbols represent that data. The line through the data is a simple polynomial curve fit that seems to fit the data fairly well. The curve fit was forced to go through the origin. Most of the runs were made in two directions to try and eliminate the effects of wind and slope. The data was taken on many different roads over several days spaced months apart.
From the plot it's easy to see that the best possible fuel economy for my car, 41 MPG, is obtained at about 40 MPH. Going slower than this hurts economy, probably because the engine isn't working as efficiently as the RPM's fall off. Above 40 MPH the economy drops as the increase in aerodynamic drag (going up as the square of the speed) overtakes further increase in engine efficiency.
The lower curve shows the average speed and fuel economy I measured for each tank of gas. In this case, I reset the trip computer when I filled up with gas then read the data at the next fill-up. This curve includes periods with the car sitting at idle such as at traffic lights as well as periods of acceleration. Again, the symbols are the measured data and the line is a curve fit which is forced to go through the origin.
Each data point on the lower curve is a mixture of city and highway driving. Sometimes there was quite a bit of highway driving on a tank yielding a higher average speed. Usually there was a lot of city driving bringing the average speed way down. The trend of the upper curve, with the peak economy occuring at 40 MPH, is not present here as the effects causing this peak are overwhelmed by the effect of stopping in traffic.
The difference between the two curves is an indication of the effect of stop-and-go traffic on fuel economy. The only time I come close to the "constant speed" value of fuel economy is on the interstate where stops are few and far between. If the curve fits were perfect, the two curves would become tangent at about 70 MPH which would correspond to non-stop interstate travel. This would yield about 34 MPG.
Also shown on the plot are the US Environmental Protection Agency (EPA) estimates of the city and highway fuel economy for the car. The city numbers are based on tests using their Urban Dynamometer Driving Schedule (UDDS). This test essentially includes stop-and-go traffic. The average speed is about 21.2 MPH. The highway numbers are based on their higway driving cycle (HFET). This test has an average speed of about 48.2 MPH and again includes some stops etc. The economy numbers I obtained for my car imply my city mileage was about 5% lower than the EPA estimate while my highway mileage was only about 1% lower. Of course this was over the full 19.5 year lifetime of the car and the mileage may have dropped off some in the later years. Apparently when I averaged speeds close to their average test speeds my driving "schedule" was fairly close to theirs.
| Return to Home Page | Last tank: December 20, 2015 |